
What Will the 2025 US Midwest Crop Tour Tell Us This Week?

- The US Midwest Crop Tour gets under way Monday morning, meaning it's time for an annual reminder of what we will learn as the week unfolds.
- Based on the percent of calculated full commercial carry covered by new-crop futures spreads, we know the commercial view of corn supply and demand has stabilized.
- Again using new-crop futures spreads as a guide, the US soybean supply and demand situation is bearish despite fewer acres planted during 2025.

Morning Summary: As many of you already knew, but I had to look up, the 2025 edition of the Midwest Crop Tour gets under way Monday. I get more entertainment than information from these silly things every year, but I know many in the industry take crop tours seriously, waiting excitedly for each social media post and nightly update. Most of the folks on pins and needles this week are the same ones who waited anxiously for the August supply and demand numbers from USDA; you know, the first “survey based” guesses of the year and wet themselves in anticipation of each Monday’s Kardashian Crop Progress and Condition numbers from NASS. What I’ve always found interesting is this group tracks everything but what the markets themselves have to say, have ever had to say, about the condition of the annual corn and soybean crops (and to a lesser degree wheat) and what the commercial side of the various markets think about actual supply and demand. To them it’s much easier to listen to the BRACE[i] Industry say what they want to hear. A couple illustrations of the situation come to mind with each crop tour: The children’s song Three Blind Mice and the parable of the blind men and an elephant.
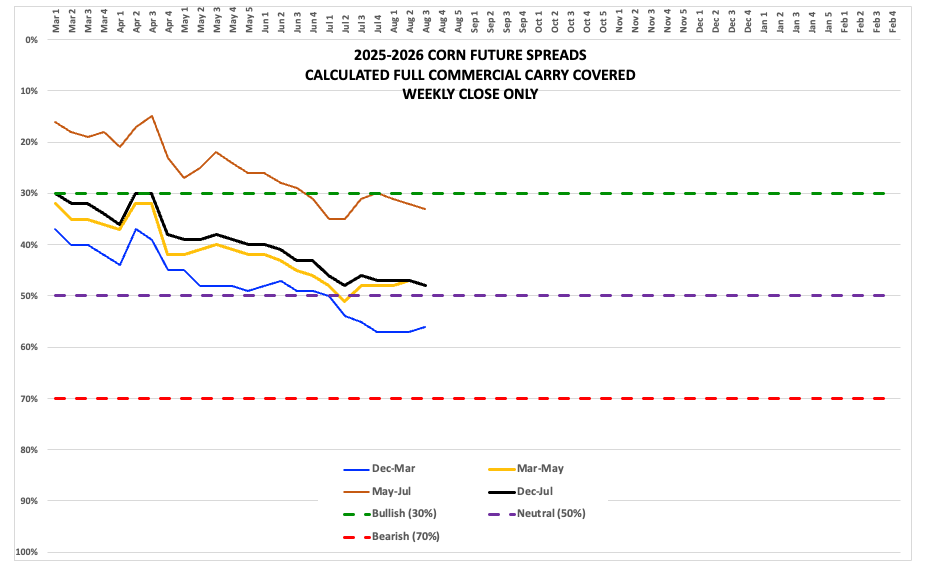
Corn: The corn market was sitting quietly in the red to start the week. The December issue (ZCZ25) posted a 3.25-cent trading range overnight on trade volume of 20,000 contracts. What has the accumulation of market information over the past year told us about the 2025 corn crop? At the end of February, we knew Dec25 had bought planted area away from November 2025 soybeans. Then we watched as new-crop futures spreads continued to cover more calculated full commercial carry starting the first week of March. The December-March spread would reach 57% the last weekly close of July, the month the crop is supposedly “made”, but has stabilized since. This tells us the commercial side has likely calculated in the largest production scenario and is now looking at the market after the crop is split between commercial and on-farm storage. We also know there will be a large supply of leftover 2024 corn mixed in with newly harvested bushels. Does it matter if the BRACE Industry’s imaginary yield number is 170 bushels per acre or 190 bpa? No. The commercial side has positioned itself on what it knows to be out there, and what its research tells them to expect on the demand side.
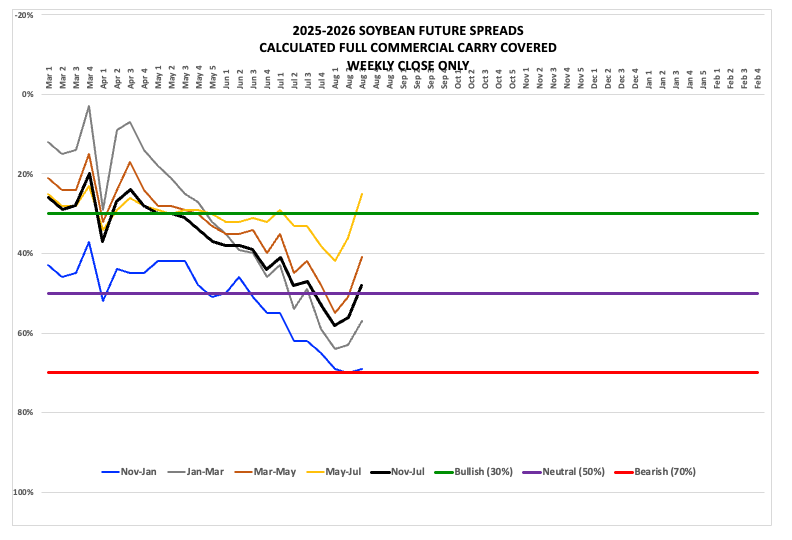
Soybeans: The soybean market was also under light pressure early Monday morning. The November issue (ZSX25) registered a trading range of 8.0 cents, all of it unchanged or lower on trade volume of about 20,000 contracts. The only thing we can read from this is the world’s largest buyer wasn’t in the market overnight. What will the crop tour tell us that we don’t already know? Nothing. But again, that can be said every year. As mentioned in the corn segment, we know the US lost planted soybean area to corn based on the Nov25 soybean/Dec25 corn futures spread from the beginning of last September through the end of February. As we turned the calendar page to March the November-January futures spread covered a neutral 43% calculated full commercial carry. By the time the last weekly close of May had rolled around, the spread covered 51%. By mid-August, the spread reached the bearish line of 70%, despite the fact the US crop lost production potential due to fewer acres. Again, yield guesses do not matter. What the commercial side has been telling us with both the Nov-Jan and January-February futures spreads is that the US will have more soybean supplies, including carryover from 2024, in relation to expected demand.
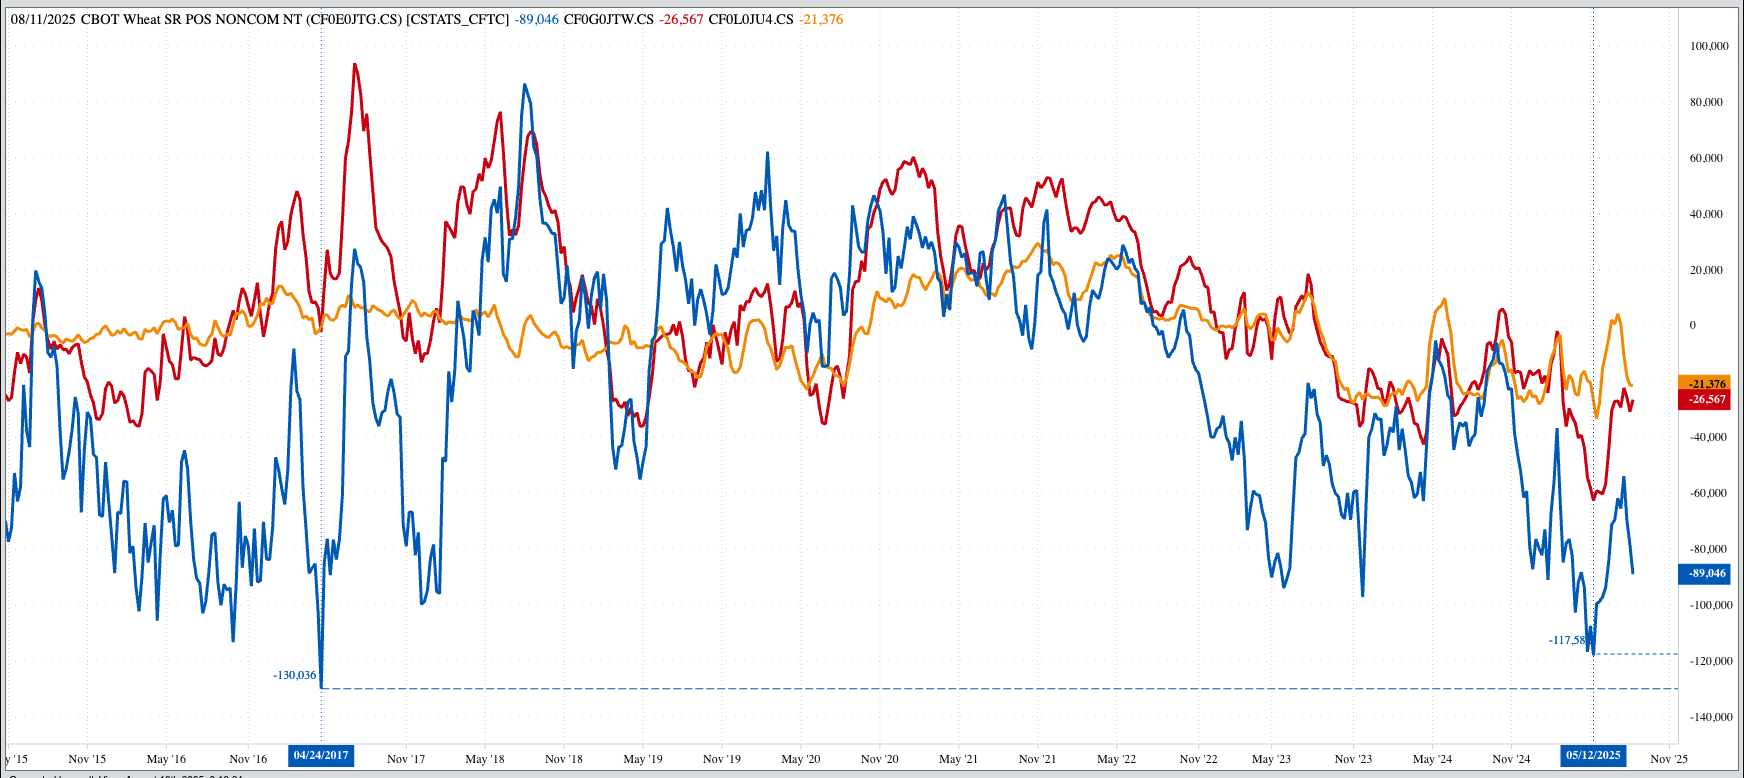
Wheat: The wheat sub-sector was also in the red pre-dawn. Why? As you know I’m not overly interested in making up reasons, so I’ll stick with the overly simplistic “there were more sellers than buyers overnight”. Not much has changed with the three markets of late. Last Friday’s CFTC Commitments of Traders report (legacy, futures only) showed Watson still held net-short futures position in all three, though the only one that increased from Tuesday-to-Tuesday was SRW. The only things this tells us is that at some point funds will do enough buying to cover these positions, though there is no fundamental reason to expect Watson to go long. Since I mentioned fundamentals, the SRW futures spreads have been moving sideways between the neutral level of 50% calculated full commercial carry and 70%, for the most part since last March. It has been a similar story in HRW, though here the July-September was covering 94% when the July issue went off the board. I thought the stage was set for a potential Down Escalator Simulator[ii], but it hasn’t happened yet. No, that doesn’t mean the HRW situation is growing more bullish, but rather it has reached equilibrium in neutral-to-bearish territory. For the record, we see the same neutral-to-bearish reads in national average basis.
[i] Broker/Reporters/Analysts/Commentators/Economists
[ii] When the nearby futures spread goes off the board, the first deferred tracks to the same level, and so on.
On the date of publication, Darin Newsom did not have (either directly or indirectly) positions in any of the securities mentioned in this article. All information and data in this article is solely for informational purposes. For more information please view the Barchart Disclosure Policy here.